
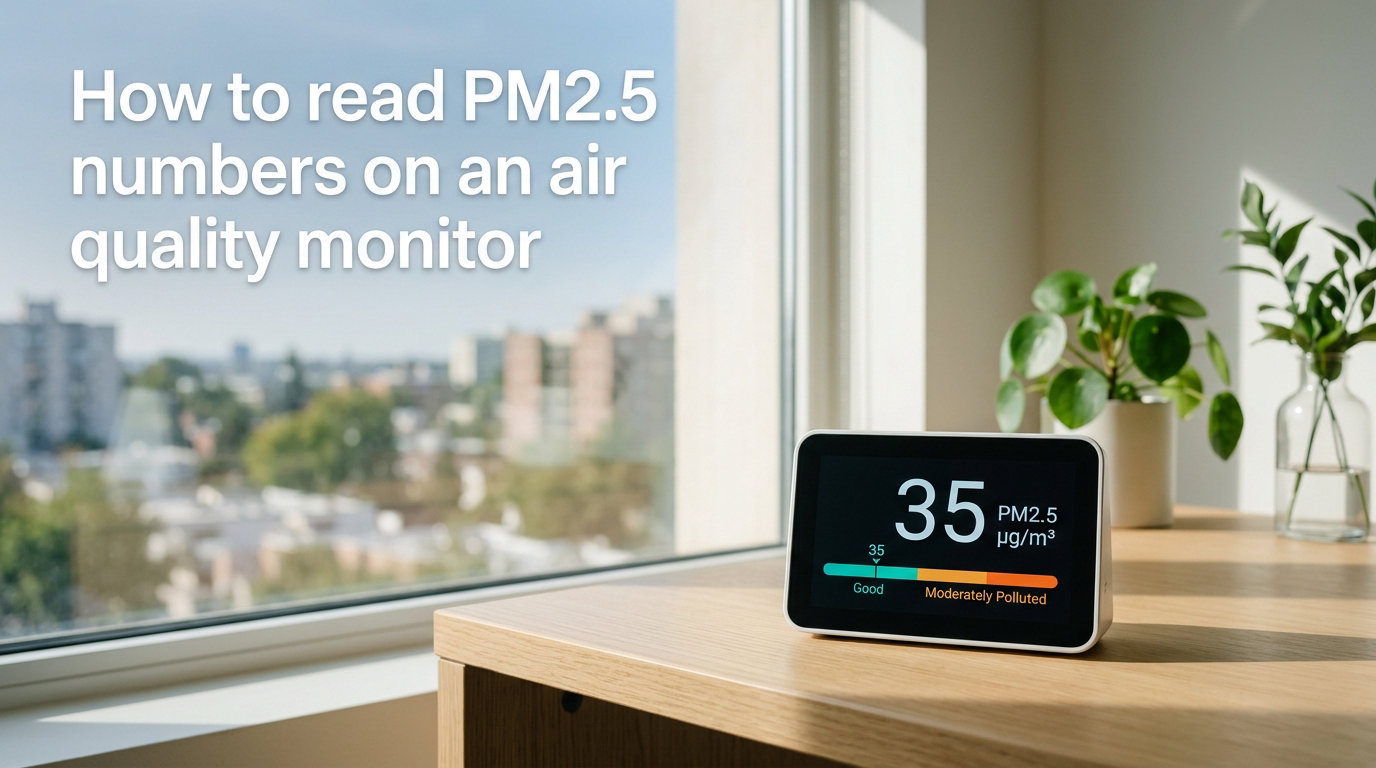
You bought an air quality monitor, turned it on, and now a number is staring back at you. Maybe it says 12. Maybe it says 85. Maybe it jumped from 8 to 240 the moment you started cooking dinner. If you are wondering what any of that means, you are not alone.
Learning how to read PM2.5 numbers on an air quality monitor is the single most useful skill for understanding your indoor air. That number tells you how many microscopic particles are floating in every cubic meter of air you breathe. Once you know the scale, you can make real decisions about when to run your purifier, open a window, or stay inside.
In this guide, I will walk you through what PM2.5 actually is, what those measurement units mean, the health-based thresholds you should care about, and how to interpret the reading on your specific monitor. I will also cover why readings fluctuate, how PM2.5 differs from AQI, and what real users get wrong about these numbers.
Table of Contents
What Is PM2.5? Definition and Particle Size Explained
PM2.5 stands for “particulate matter 2.5.” It refers to any airborne particle that measures 2.5 microns or less in diameter. To put that in perspective, a single human hair is about 50 to 70 microns wide. That means a PM2.5 particle is roughly 30 times smaller than the width of a human hair.
These particles are so small you cannot see them individually. Even when millions of them cluster together, they only show up as a faint haze or the smog hanging over a city. The reason PM2.5 matters more than larger dust particles comes down to biology.
Your body has natural defenses against larger particles. Nose hairs and mucus trap particles bigger than 10 microns before they reach your lungs. But PM2.5 particles are tiny enough to slip past every defense. They travel deep into the alveoli, the tiny air sacs where oxygen enters your bloodstream.
From there, the smallest particles can pass through lung tissue directly into your blood. Once circulating, they reach your heart, brain, and other organs. This is why PM2.5 is linked to cardiovascular disease, respiratory illness, cognitive decline, and other serious health problems.
PM2.5 is not one specific substance. It is a category that includes hundreds of different particle types. Combustion particles from vehicles, wildfire smoke, cooking fumes, candle soot, industrial emissions, and even fine dust all qualify as PM2.5 if they are small enough.
There is also PM10, which refers to particles up to 10 microns. PM10 includes larger dust and pollen. Some monitors display both PM2.5 and PM10 readings. For health purposes, PM2.5 is the number that matters most because those are the particles that reach your bloodstream.
How to Read PM2.5 Numbers on an Air Quality Monitor
When you learn how to read PM2.5 numbers on an air quality monitor, the first thing to understand is the unit of measurement. Almost every monitor displays PM2.5 in micrograms per cubic meter, written as µg/m3.
This unit tells you the total mass of fine particles in one cubic meter of air. A reading of 15 µg/m3 means that if you filled a box one meter on each side with your room’s air, that box would contain 15 micrograms of PM2.5 particles.
Most consumer monitors use a laser scattering sensor to measure this. Inside the device, a laser beam shines across a small air chamber. A fan pulls air through the chamber continuously. When particles pass through the laser beam, they scatter the light. A photodetector measures how much light scatters and at what angles.
The sensor uses that scattering pattern to estimate both particle count and particle size. From there, it calculates a mass concentration estimate and displays it as the µg/m3 number you see on screen.
Here is how to actually read and interpret the number on your display in five steps:
Step 1: Check the unit. Look at the small text next to the number. If it says µg/m3, you are looking at raw PM2.5 concentration. If it says AQI or just a number without units, your monitor may be converting to Air Quality Index already.
Step 2: Note the color indicator. Many monitors show a green, yellow, orange, or red light alongside the number. Green generally means good, yellow means moderate, and red means unhealthy. But do not rely on the color alone, because different brands use different thresholds for their color bands.
Step 3: Compare to EPA thresholds. The most reliable reference is the EPA PM2.5 scale, which I cover in detail below. Use this scale rather than the manufacturer’s color system, which is often more lenient.
Step 4: Watch for trends, not single readings. A single number is a snapshot. What matters is the trend over minutes and hours. A reading that spikes to 80 during cooking then drops to 12 within 20 minutes is very different from a steady 80 all day.
Step 5: Consider the context. Did you just cook, light a candle, or open a window near traffic? Context explains most spikes. I have seen my own monitor jump from 8 to over 300 the moment I started frying food on the stove.
PM2.5 Threshold Chart: What Each Number Means for Your Health
The EPA divides PM2.5 levels into health-based categories using color coding. These thresholds apply to both indoor and outdoor air. Here is what each range means and what you should do at each level.
Good: 0 to 9.0 µg/m3 (Green). Air quality is excellent at this level. No health risk exists for any group. You can keep windows open, exercise outdoors, and go about normal activities without concern. Most homes with a running air purifier sit in this range.
Moderate: 9.1 to 35.4 µg/m3 (Yellow). Air quality is acceptable for most people. However, those who are unusually sensitive to particle pollution may want to limit prolonged outdoor exertion. Indoors, this is a good time to turn on your air purifier if it is off.
Unhealthy for Sensitive Groups: 35.5 to 55.4 µg/m3 (Orange). Children, older adults, and people with heart or lung disease, asthma, or other respiratory conditions should reduce exposure. Healthy adults may notice minor effects during heavy exertion. Run your purifier on high and keep windows closed at this level.
Unhealthy: 55.5 to 125.4 µg/m3 (Red). Everyone may begin to experience health effects at this level. Sensitive groups could experience more serious effects. Avoid outdoor exertion and keep indoor air filtered. This range is common during active wildfire events or heavy traffic exposure.
Very Unhealthy: 125.5 to 225.4 µg/m3 (Purple). Health alert levels. Everyone should limit outdoor activity. Sensitive groups should avoid all outdoor exposure. Indoors, run multiple purifiers if possible and seal gaps around doors and windows.
Hazardous: 225.5 µg/m3 and above (Maroon). This is emergency-level air quality. Everyone should stay indoors with filtered air. This range occurs during severe wildfire smoke, heavy industrial pollution, or dust storms. If you must go outside, wear an N95 or KN95 mask.
One important note about these thresholds: the World Health Organization recommends even stricter limits. The WHO guideline for annual PM2.5 exposure is just 5 µg/m3, and the 24-hour guideline is 15 µg/m3. This means the EPA’s “Good” range would still exceed WHO recommendations at the upper end.
Many forum users have noticed that their air purifier brand uses more lenient thresholds. For example, some Levoit models display 0 to 39 µg/m3 as “Very Good” on their indicator, while the EPA considers anything above 35.4 as already in the unhealthy-for-sensitive-groups territory. When in doubt, trust the EPA scale over the manufacturer’s color system.
Common Sources of PM2.5 Indoors and Outdoors
Understanding where PM2.5 comes from helps you make sense of spikes on your monitor. Sources fall into two main categories: indoor and outdoor.
Indoor sources are often the biggest surprise for new monitor owners. Cooking is the number one cause of indoor PM2.5 spikes, especially frying, grilling, and broiling. Gas stoves produce combustion particles that can push readings above 200 in minutes. Candles, incense, fireplaces, and wood stoves are also major contributors.
Other indoor sources include cigarette smoke, vaping aerosol, burning food, dust from vacuuming or sweeping without a HEPA-filtered machine, pet dander in fine form, and aerosol sprays. Even printer toner and certain craft activities can contribute particles.
Outdoor sources enter your home through open windows, doors, ventilation systems, and small gaps in the building envelope. Vehicle exhaust from nearby roads is one of the most common outdoor sources. Industrial emissions, construction dust, agricultural burning, and wildfire smoke can all drive outdoor PM2.5 dangerously high.
Wildfire smoke deserves special attention. During active fire season, outdoor PM2.5 can exceed 200 µg/m3 for days. Even with windows closed, smoke particles infiltrate homes and can push indoor readings above 50. If you live in a fire-prone region, monitoring PM2.5 during fire season is essential for protecting your health.
PM2.5 vs AQI: Understanding the Difference
One of the most common points of confusion I see in air quality forums is the difference between PM2.5 and AQI. Some monitors show one, some show the other, and some show both. Here is what you need to know.
PM2.5 measured in µg/m3 is a raw concentration. It tells you the actual mass of particles in the air. It is a direct, physical measurement.
AQI, or Air Quality Index, is a converted scale. Government agencies created AQI to make air quality data easier for the public to understand. Instead of showing raw µg/m3, AQI converts the concentration into a 0 to 500+ number where each range corresponds to a health category.
The conversion is not linear. A PM2.5 reading of 12 µg/m3 does not equal an AQI of 12. Instead, that same concentration translates to an AQI of roughly 50. A PM2.5 reading of 35 µg/m3 converts to an AQI of about 100.
Here is a quick reference for common conversions. PM2.5 of 9 µg/m3 equals AQI 37 (Good). PM2.5 of 20 µg/m3 equals AQI 68 (Moderate). PM2.5 of 35 µg/m3 equals AQI 99 (Moderate). PM2.5 of 55 µg/m3 equals AQI 150 (Unhealthy for Sensitive Groups). PM2.5 of 125 µg/m3 equals AQI 193 (Unhealthy).
The key takeaway is that you cannot directly compare a PM2.5 number to an AQI number. If your monitor shows 35, check whether the unit says µg/m3 or AQI. A reading of 35 µg/m3 is moderate. A reading of 35 AQI is excellent. Knowing which scale your device uses prevents unnecessary worry.
Why Your PM2.5 Reading Fluctuates
If you have watched your air quality monitor for any length of time, you have probably noticed the number bouncing around. This is normal, but it causes real anxiety for many users. Understanding why readings fluctuate helps you interpret the data without panic.
First, air is not uniform. The air near your stove is very different from the air across the room. Your monitor samples a tiny volume of air, and that sample changes constantly as air circulates. A small change in airflow can shift the reading by 5 to 10 µg/m3 in seconds.
Second, household activities cause real spikes. Cooking, cleaning, opening a door, walking across a carpet, and even moving around can all disturb particles and temporarily raise readings. These spikes usually resolve within 10 to 30 minutes as particles settle or your purifier catches up.
Third, humidity affects sensor readings. Laser scattering sensors can misinterpret water droplets as particles. On humid days, especially above 60 percent relative humidity, your monitor may show elevated PM2.5 even when actual particle levels are low. Some higher-end monitors apply humidity compensation, but budget models often do not.
Fourth, sensor accuracy varies widely. Forum users have reported that some Xiaomi sensors can read up to 48 times higher than dedicated reference monitors. Built-in sensors on air purifiers are generally less accurate than standalone air quality monitors. If your readings seem off, compare your monitor’s data against a nearby government monitoring station using a site like AirNow.gov.
The best approach is to look at trends over time rather than reacting to every single number. Track your daily average and watch for sustained elevation, which is more meaningful than a brief spike.
How to Lower Your Indoor PM2.5 Levels
Once you can read your PM2.5 numbers, the next question is how to bring them down. Here are the most effective strategies based on what the data shows.
Run a HEPA air purifier continuously in the rooms where you spend the most time. A true HEPA filter captures 99.97 percent of particles 0.3 microns and larger, which covers PM2.5. Match the purifier’s Clean Air Delivery Rate to your room size for best results.
Always use your kitchen exhaust fan when cooking, especially with a gas stove. Vent it to the outside if possible. This single step can cut cooking-related PM2.5 spikes by 50 percent or more.
Avoid burning candles and incense indoors, or switch to electric alternatives. If you smoke or vape, take it outside. Vacuum with a HEPA-filtered machine and use a damp cloth for dusting instead of dry methods that send particles airborne.
During high outdoor pollution days or wildfire smoke events, keep windows and doors closed. Seal gaps with weatherstripping if outdoor smoke regularly infiltrates your home. Check your local AQI before opening windows for fresh air.
Finally, replace your air purifier filters on schedule. A clogged HEPA filter loses effectiveness and may allow particles to pass through. Most filters need replacement every 6 to 12 months depending on usage and air quality conditions.
FAQs
What should my PM2.5 reading be?
A healthy indoor PM2.5 reading is 9.0 µg/m3 or lower, which falls in the EPA’s Good range. The WHO recommends an even stricter limit of 15 µg/m3 for 24-hour exposure. If you have an air purifier running, most homes can maintain levels between 1 and 10 µg/m3.
What level of PM2.5 is unhealthy?
PM2.5 becomes unhealthy for the general population at 55.5 µg/m3 and above. Levels between 35.5 and 55.4 µg/m3 are already unhealthy for sensitive groups including children, seniors, and people with respiratory conditions. Readings above 125.5 µg/m3 are considered very unhealthy for everyone.
How to read an air quality monitor?
Check the unit first. If it says µg/m3, you are reading raw PM2.5 concentration. If it says AQI, the number is on a 0 to 500 converted scale. Compare your reading to the EPA thresholds: 0 to 9 is Good, 9.1 to 35.4 is Moderate, 35.5 to 55.4 is Unhealthy for Sensitive Groups, and anything higher needs action.
What is a good number on an air purifier?
A good PM2.5 number on an air purifier display is anything under 9 µg/m3. This indicates clean air in the EPA Good range. Some brands display green or blue lights at this level. If your purifier shows a number above 35, keep it running on high until the reading drops back into the single digits or low teens.
Conclusion
Knowing how to read PM2.5 numbers on an air quality monitor turns a confusing display into actionable information. The key is understanding that µg/m3 is a direct measurement of particle mass, that the EPA scale gives you reliable health thresholds, and that trends matter more than any single reading.
Aim to keep your indoor PM2.5 below 9 µg/m3 for the cleanest air. Trust the EPA thresholds over manufacturer color codes, and remember that AQI and PM2.5 are different scales. With this knowledge, you can confidently interpret your monitor, respond to spikes, and make informed decisions about when to filter, ventilate, or stay indoors.