
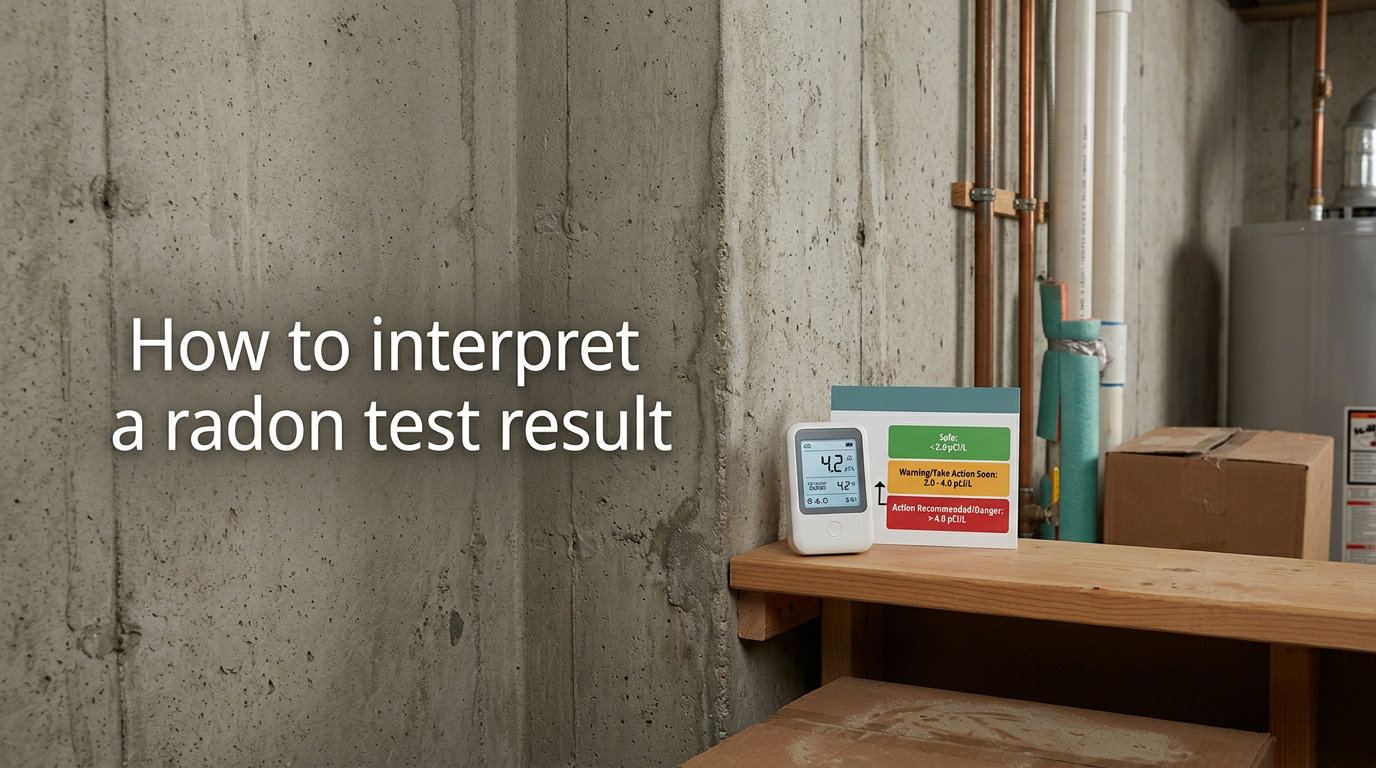
That single number on your radon report can feel like a foreign language. You ran the test, mailed in the kit, or checked your continuous monitor app, and now you are staring at something like “3.8 pCi/L” wondering whether to panic, shrug, or call a contractor. Most homeowners have been exactly where you are.
Knowing how to interpret a radon test result matters more than almost any other home safety reading you will ever see. Radon is invisible, odorless, and tasteless, and it is the second leading cause of lung cancer in the United States, responsible for roughly 21,000 deaths each year. Unlike a smoke alarm or a carbon monoxide detector, radon does not announce itself. The number on that report is the only warning you get.
In this guide, I walk you through exactly what your radon test result means, breaking down the measurement unit (pCi/L), the three EPA risk tiers, what causes levels to swing, and the specific actions to take for every possible reading. By the end, you will be able to look at any radon report and know precisely what to do next.
Table of Contents
What Is Radon and Why Your Test Result Matters
Radon is a naturally occurring radioactive gas produced when uranium breaks down in soil, rock, and water. It seeps up through the ground and enters homes through cracks in the foundation, gaps around pipes, sump pits, crawl spaces, and even well water. Once inside, it accumulates because modern homes are sealed tightly for energy efficiency.
The reason your radon test result carries so much weight is simple: long-term exposure to elevated radon damages lung tissue at the cellular level. The U.S. Environmental Protection Agency (EPA) and the Centers for Disease Control and Prevention (CDC) both classify radon as a Class A carcinogen, the same category as tobacco smoke and asbestos. The risk is not theoretical. It is documented across decades of epidemiological studies.
Here is what surprises many homeowners: radon can show up in any home, in any state, in any type of construction. A brand-new house can test higher than a 100-year-old one. Your neighbor’s low reading tells you nothing reliable about your own home. The only way to know your number is to test, and the only way to act on that number is to interpret it correctly.
Understanding pCi/L: The Language of Radon
Radon concentration in air is measured in picocuries per liter, abbreviated as pCi/L. A picocurie is one-trillionth of a curie, which is a unit of radioactive decay. In plain terms, pCi/L tells you how many radon atoms are decaying (and releasing alpha radiation) in each liter of your home’s air.
You will sometimes see radon reported in becquerels per cubic meter (Bq/m3), the international unit. The conversion is straightforward: 1 pCi/L equals 37 Bq/m3. Most U.S. labs and devices use pCi/L, so this guide focuses on that unit. If your device or report uses Bq/m3, divide by 37 to convert to pCi/L.
Here is the part that often gets glossed over: there is no truly safe level of radon exposure. The EPA sets an action level, but even levels below that threshold carry some risk. Outdoor air averages about 0.4 pCi/L, which represents the natural background we all breathe. The average indoor level in U.S. homes sits around 1.3 pCi/L. Anything significantly above that baseline is worth your attention.
One more point worth understanding before we get to the tiers. Radon measurements are always averages over a window of time. A short-term test reports the average over two to seven days. A long-term test reports the average over three to twelve months. A continuous monitor reports the average over hours, days, weeks, or months. The longer the measurement window, the more accurately that single number reflects your true exposure.
How to Interpret a Radon Test Result: The Three Tiers
This is the section most people came here for. The EPA framework breaks radon test results into three action tiers. Each tier comes with a clear recommended response. Read the tier that matches your number and follow the guidance.
Tier 1: Below 2.0 pCi/L (Low Risk)
A result under 2.0 pCi/L is generally considered low. No immediate action is required. The EPA does not recommend mitigation at this level. Your home’s radon concentration is close to or only slightly above the national indoor average.
That said, low does not mean zero. Radon levels change seasonally, with weather, and as your home ages. The EPA recommends retesting every two to five years even when your initial result is low. If you make major renovations, finish a basement, or change your HVAC system, test again sooner.
If you use a continuous monitor, you may notice occasional hourly spikes above 2.0 even when your long-term average sits well below. That is normal and is not a cause for alarm. The long-term average is what determines your actual exposure.
Tier 2: 2.0 to 3.9 pCi/L (Consider Mitigation)
Results in the 2.0 to 3.9 range sit in a gray zone. The EPA recommends that homeowners in this range “consider fixing” their home. Translation: there is no immediate emergency, but there is meaningful risk, especially over decades of living in the home.
Many homeowners in this tier choose to install a mitigation system, particularly if anyone in the household is a smoker, a former smoker, or has a history of lung disease. Smoking multiplies radon-related lung cancer risk dramatically. For a lifelong nonsmoker living at 3.0 pCi/L, the lifetime risk is roughly 2 in 1,000. For a smoker at the same level, the risk is several times higher.
If you land in this tier, the smart move is to follow up with a long-term test (90 days or more) before making a mitigation decision. A short-term test at 2.8 pCi/L may reflect a weather pattern or a closed-house condition that inflated the number. A long-term test smooths out those fluctuations and tells you whether the level is consistently in this range.
Tier 3: 4.0 pCi/L and Above (EPA Action Level)
A result of 4.0 pCi/L or higher triggers the EPA action level. The recommendation is clear: fix the home. This is not a suggestion to consider, it is a recommendation to act. The higher the number, the more urgent the action.
If your first test was a short-term test, the EPA recommends following up with a second short-term test or, preferably, a long-term test before installing a mitigation system. This confirmation step matters because short-term results can be skewed by short-term conditions. However, if your result is very high (8.0 pCi/L or above), you can proceed with mitigation on a single short-term test rather than waiting months for confirmation.
For context on how high radon can climb: I have seen reports from homeowners posting results above 50 pCi/L, and EPA data shows some homes exceed 100 pCi/L. There is no upper bound on what a home can produce. The good news is that mitigation works in nearly every case, often reducing levels below 2.0 pCi/L.
Quick Reference: Radon Level Tiers and Actions
- Below 2.0 pCi/L: Low risk. No action needed. Retest every 2 to 5 years.
- 2.0 to 3.9 pCi/L: Some risk. EPA recommends considering mitigation. Follow up with a long-term test to confirm.
- 4.0 to 7.9 pCi/L: EPA action level exceeded. Confirm with a second test, then install mitigation.
- 8.0 pCi/L and above: High risk. Mitigation can proceed on a single confirmed short-term test. Act promptly.
Print this reference or screenshot it. When you (or a family member) get a result months from now, you will not have to remember the thresholds.
Types of Radon Tests and How Results Are Reported
The way your result is reported depends on the type of test you used. Understanding the test type helps you interpret the number correctly and avoid common misreadings.
Short-term tests run for 2 to 7 days. They use activated charcoal canisters, alpha track detectors, or electret ion chambers. Labs report a single average pCi/L value for the entire test period. Short-term tests are useful for quick screening, especially during real estate transactions, but they are snapshots. A single short-term result can swing 50 percent or more above or below your true long-term average.
Long-term tests run for 90 days to 12 months, with alpha track and electret detectors being the most common. A long-term result gives you a far more accurate picture of your actual year-round exposure, because it captures seasonal variation, HVAC cycling, and weather effects. The EPA specifically recommends long-term testing for follow-up confirmation whenever a short-term test comes back at 4.0 pCi/L or higher.
Continuous radon monitors (CRMs) are electronic devices that sample air every hour or every few minutes and display rolling averages. Consumer devices like the Airthings Wave, Ecosense EcoQube, and similar models show real-time readings plus 1-day, 7-day, 30-day, and long-term averages. Professional CRMs used during home inspections log data for reports. The benefit of a CRM is that you see trends, not just one number. You can spot whether radon climbs at night, drops when windows open, or rises during certain seasons.
When reading any result, focus on the long-term average, not the hourly spikes. A continuous monitor showing a 24-hour average of 1.8 pCi/L is good news even if last Tuesday at 3 a.m. it briefly hit 9 pCi/L. Short bursts do not define your exposure. The sustained average does.
Why Radon Levels Fluctuate and What Causes False Readings
This is where most homeowners get confused, and where most guides fall short. Radon is not a static number. It moves constantly, sometimes dramatically, and understanding those movements is the key to reading your result without unnecessary anxiety.
Diurnal (day-night) cycles: Radon almost always rises at night and falls during the day. As temperatures cool in the evening, warm air inside the home rises and exits through the roof (the stack effect), pulling soil gases, including radon, up through the foundation. Nighttime readings can be two to five times higher than midday readings in the same home. If your continuous monitor spikes overnight, this is why.
Barometric pressure: When outdoor atmospheric pressure drops (often before a storm), radon is drawn more forcefully from the soil into the home. Low-pressure systems are the number-one cause of unexplained spikes on a continuous monitor. The reading is real, but it represents a temporary weather-driven condition, not your baseline.
Seasonal variation: Radon levels tend to run higher in winter for two reasons. First, homes are sealed tight with windows closed, trapping radon inside. Second, the temperature differential between the heated home and the cold ground strengthens the stack effect. A winter short-term test can easily read 30 to 50 percent higher than a summer test in the same home.
HVAC operation: Furnaces, fans, and exhaust systems change the air pressure inside your home. A furnace running constantly creates negative pressure in the basement, drawing more radon in. A bathroom or kitchen exhaust fan running during a short-term test can skew the result. The EPA requires “closed-house conditions” (all windows and exterior doors shut, except for normal entry and exit) for 12 hours before and during short-term tests. Failing to follow this is one of the most common reasons for inaccurate results.
Rain and saturated soil: Heavy rain saturates the soil around your foundation and can push radon upward through any opening. You may see a spike after a multi-day rainstorm. Snow cover and frozen ground can have a similar sealing effect that funnels radon into the home.
Things that can produce a falsely high reading: A test kit placed in a damp basement, near a sump pump, next to a drafty window, in direct sunlight, or in a room with a running dehumidifier can all skew results upward. Charcoal canisters are especially sensitive to humidity. Always follow the lab’s placement instructions precisely.
Things that can produce a falsely low reading: Leaving windows open during a short-term test, running exhaust fans continuously, placing the test on an upper floor when the basement is the actual problem area, or testing during a prolonged low-pressure weather pattern can all drag a reading below your true level.
The takeaway: never make a mitigation decision based on a single short-term reading without understanding the conditions under which it was collected. If anything about the test conditions was off, treat the result as preliminary and run a confirmation test.
What to Do If Your Radon Levels Are Elevated
If your result lands at 4.0 pCi/L or above, here is the sequence of steps that protects you, your family, and your wallet.
Step 1: Confirm with a second test. The EPA specifically recommends follow-up testing before committing to mitigation, unless your result was very high (8.0 pCi/L or above). For results between 4.0 and 8.0, run either a second short-term test or, preferably, a long-term test. If the second result also comes back at or above 4.0, proceed to mitigation.
Step 2: Hire a certified radon mitigation professional. Look for contractors certified by a recognized national program such as the American Association of Radon Scientists and Technologists (AARST) or your state’s radon program. Avoid general contractors who tack radon onto a list of services. Properly designed mitigation is engineered for your specific home.
Step 3: Understand the standard fix. The most common and effective mitigation method is active soil depressurization (ASD), sometimes called sub-slab depressurization. The installer drills a hole through your foundation slab, inserts a PVC pipe, runs it to the exterior (or through the attic), and connects a continuously running fan that draws radon from beneath the slab and vents it above the roofline before it can enter the home. Well-designed ASD systems typically reduce radon to below 2.0 pCi/L, often below 1.0.
Step 4: Verify the system worked. After installation, wait 24 to 48 hours and run a short-term test to confirm the system is performing. Then conduct a long-term test within the first year to verify sustained performance. Most professionals include a follow-up test in their installation package.
Step 5: Check your manometer regularly. Every ASD system includes a U-tube manometer mounted on the vent pipe, typically in the basement. This liquid-filled gauge shows that the fan is maintaining suction under your slab. When the fan is running correctly, the liquid levels on the two sides of the U are unequal, usually by 1 to 4 inches. If the levels are even, the fan has stopped or the system has lost suction, and you need to call your installer immediately.
Step 6: Retest every two years. Even with a functioning mitigation system, the EPA recommends retesting every two years. Fans fail, foundations shift, and soil conditions change. A simple follow-up test is cheap insurance that your system is still doing its job.
Health Risks: Putting Your Number in Context
A raw pCi/L number means more when you understand what it represents in real risk. The EPA publishes risk estimates that translate radon concentration into lifetime lung cancer risk.
For a lifelong nonsmoker exposed to 4.0 pCi/L over a lifetime, the risk of developing lung cancer is about 7 in 1,000. At 10 pCi/L, that risk climbs to about 18 in 1,000. At 20 pCi/L, it reaches roughly 36 in 1,000. These numbers are not trivial, but they are also not a guarantee of illness. They are statistical probabilities across large populations.
For smokers, the picture is much starker. Smoking and radon exposure multiply each other rather than simply adding. A smoker exposed to 4.0 pCi/L faces a lifetime lung cancer risk of about 62 in 1,000, compared to roughly 7 in 1,000 for a smoker with no excess radon exposure. At 10 pCi/L, that combined risk exceeds 120 in 1,000. This is why radon mitigation is especially urgent in households with current or former smokers.
One more point that often gets lost: radon risk is cumulative. It is not the spike on Tuesday night that matters most, it is the average exposure sustained over years and decades. This is exactly why the long-term average is the number to track, and why reducing even moderately elevated levels pays off over a lifetime in the home.
Frequently Asked Questions About Radon Test Results
How do I read my radon test results?
Your radon test result is reported as a single number in picocuries per liter (pCi/L). Below 2.0 pCi/L is low risk. Between 2.0 and 3.9, the EPA recommends considering mitigation. At 4.0 pCi/L or higher, the EPA action level is exceeded and you should fix your home. Read the average value for the test period, not individual spikes.
What is a bad radon test result?
A radon test result of 4.0 pCi/L or higher is considered bad by EPA standards and triggers the action level for mitigation. Results above 8.0 pCi/L are high enough to proceed with mitigation on a single confirmed test. The higher the number, the greater the lifetime lung cancer risk.
What is a good reading on a radon test?
A good radon reading is anything below 2.0 pCi/L. At this level, no action is required and the risk is considered low. The U.S. indoor average is about 1.3 pCi/L, so anything near or below that number is well within the normal range. Retest every two to five years even when results are good.
What level of radon do most homes have?
The average indoor radon level in U.S. homes is approximately 1.3 pCi/L, according to the EPA. Outdoor air averages about 0.4 pCi/L. Approximately 1 in 15 U.S. homes has radon levels at or above the EPA action level of 4.0 pCi/L. Levels vary widely by geography, construction type, and soil conditions.
What throws off a radon test?
Radon tests can be skewed by open windows, running exhaust fans, improper test kit placement, high humidity, strong storms and low barometric pressure, running a furnace or dehumidifier nearby, and failing to maintain closed-house conditions for 12 hours before a short-term test. Always follow the lab’s placement instructions and the EPA closed-house protocol.
How often do homes fail radon tests?
About 1 in 15 homes in the United States has radon levels at or above the EPA action level of 4.0 pCi/L. In high-radon zones such as parts of the Midwest, Mountain West, and Appalachian regions, that rate can climb to 1 in 3 homes or higher. Geography and construction type both strongly influence the odds.
Conclusion: Your Number, Your Next Move
Learning how to interpret a radon test result comes down to one framework: under 2.0 is low, 2.0 to 3.9 warrants consideration, and 4.0 and above means act. The number on your report is not a verdict. It is information that tells you exactly what to do next, whether that is retesting in two years, running a long-term confirmation test, or hiring a certified mitigation professional.
Radon is one of the few household hazards you can fully control, often with a single mitigation system that drops your reading by 80 percent or more. Test your home, read your result against the three tiers, and take the recommended action. That single decision is one of the most meaningful investments you can make in the long-term health of everyone living under your roof.
2 thoughts on “How to Interpret a Radon Test Result (September 2026) Expert Guide”